Download:
Regional geological sketch (a) and geological map (b) of the Sinongduo ore concentration area (Yang et al., 2021)
Figures of the Article
-
![]() Regional geological sketch (a) and geological map (b) of the Sinongduo ore concentration area (Yang et al., 2021)
Regional geological sketch (a) and geological map (b) of the Sinongduo ore concentration area (Yang et al., 2021)
-
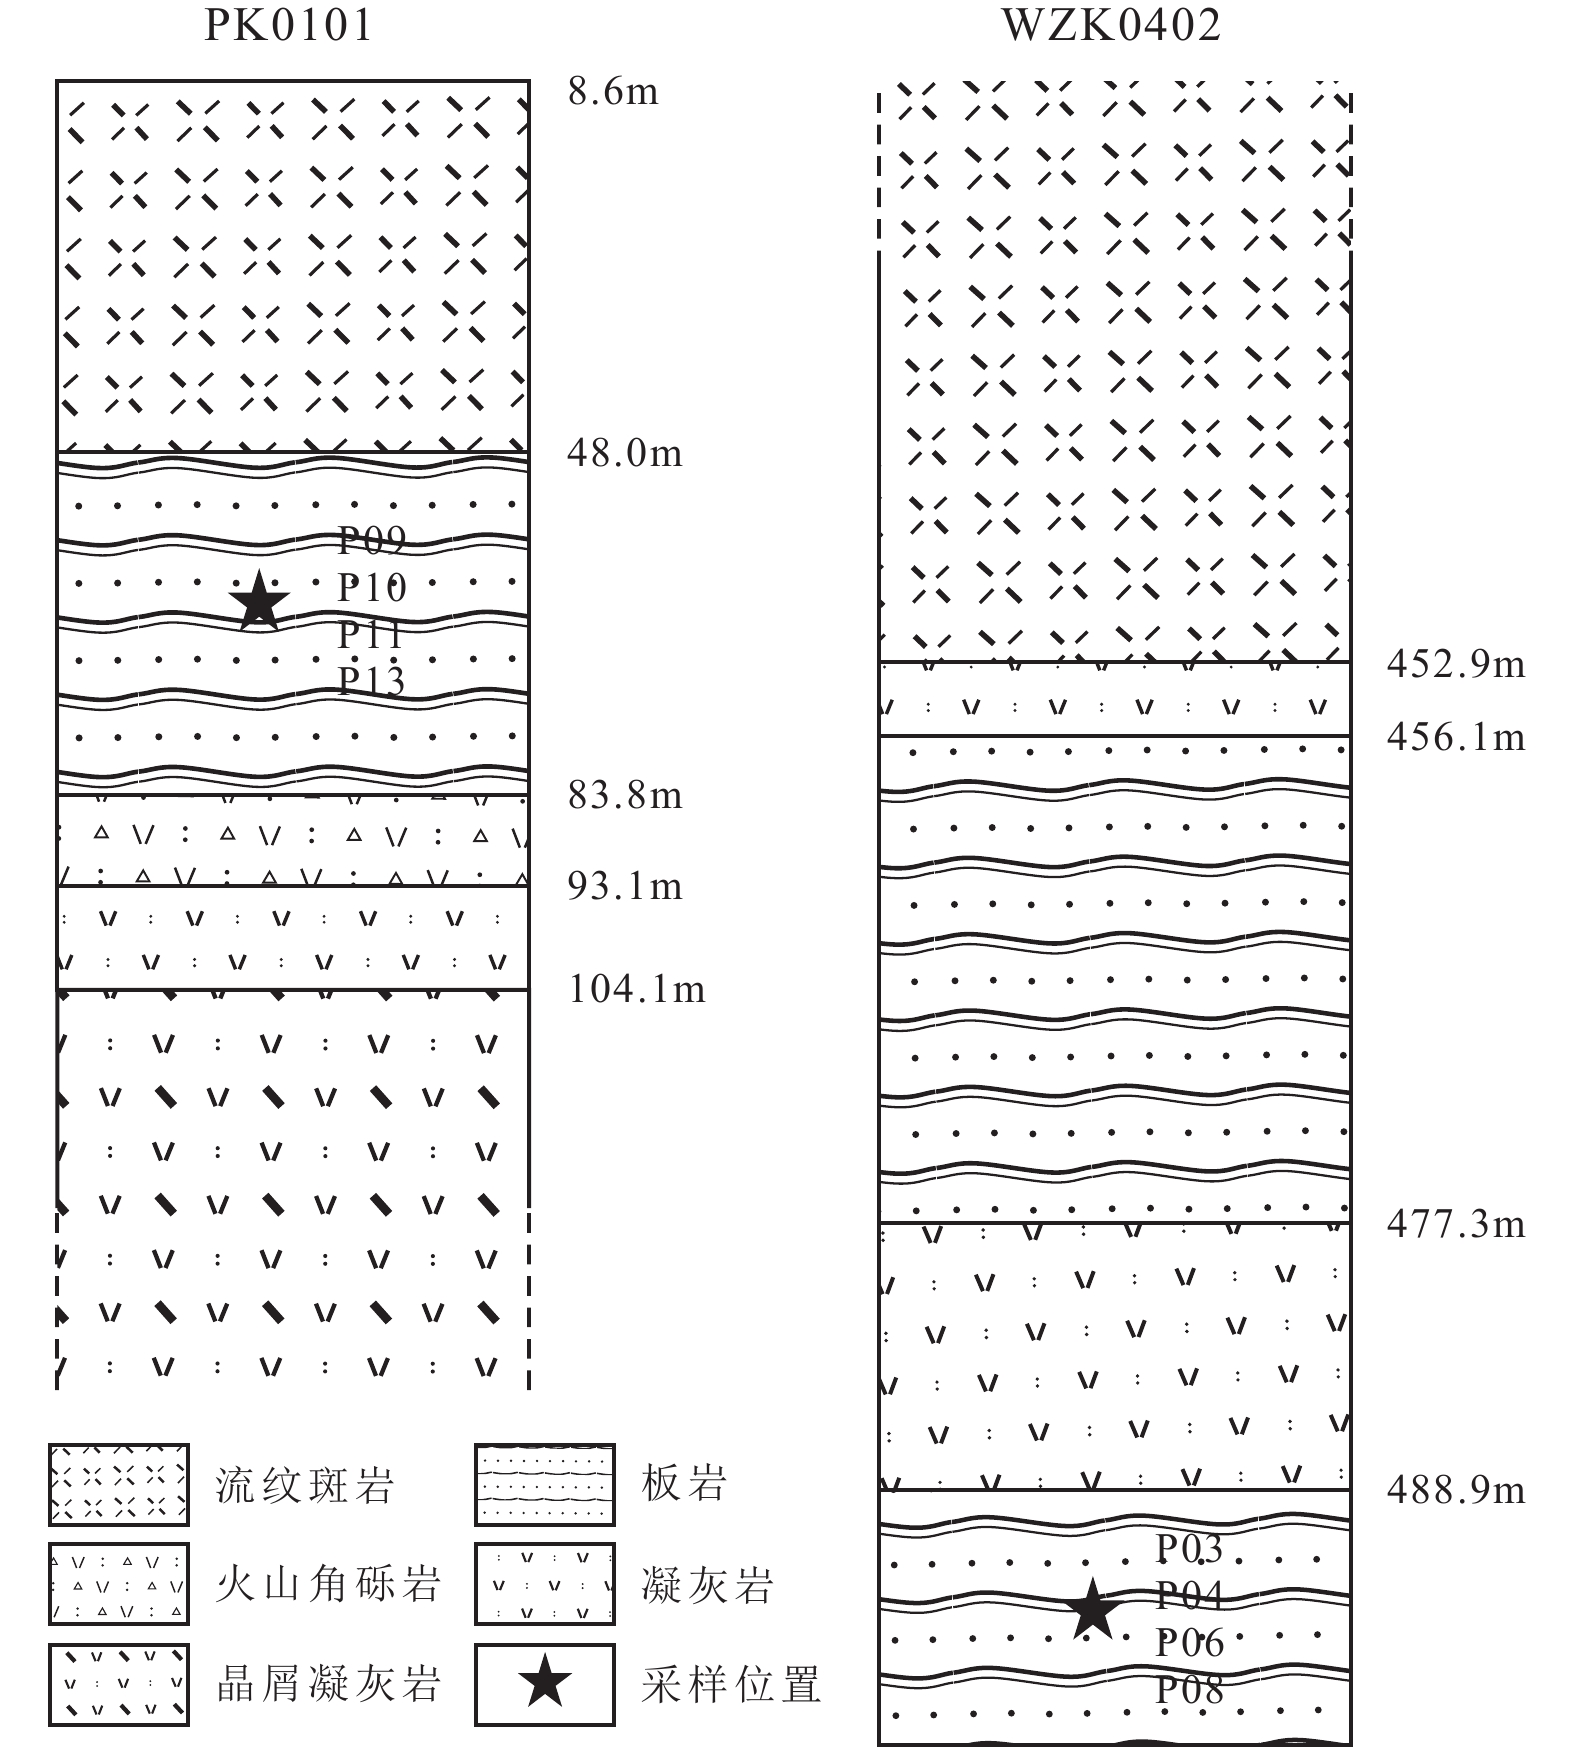
![]() Columnar illustration of drill cores of the Sinongduo Ag polymetallic deposit
Columnar illustration of drill cores of the Sinongduo Ag polymetallic deposit
-
![]() Characteristics of the slate from the Sinongduo Ag polymetallic deposit
Characteristics of the slate from the Sinongduo Ag polymetallic deposit
-
![]() Microphotographs of the slate from the Sinongduo Ag polymetallic deposit
Microphotographs of the slate from the Sinongduo Ag polymetallic deposit
-
![]() Chondrite-normalized (a) (Sun and McDonough, 1989) and UCC-normalized (Taylor and McLennan, 1995) REE (b) patterns for the slate from the Sinongduo Ag polymetallic deposit (the data of Sinongduo tuff, slate from Zhaxikang Ridang Formation, and slate from Wenjiangsi Au deposite are after Ding et al., 2017, Guan et al., 2014, and Dai et al., 2011, respectively; the same below)
Chondrite-normalized (a) (Sun and McDonough, 1989) and UCC-normalized (Taylor and McLennan, 1995) REE (b) patterns for the slate from the Sinongduo Ag polymetallic deposit (the data of Sinongduo tuff, slate from Zhaxikang Ridang Formation, and slate from Wenjiangsi Au deposite are after Ding et al., 2017, Guan et al., 2014, and Dai et al., 2011, respectively; the same below)
-
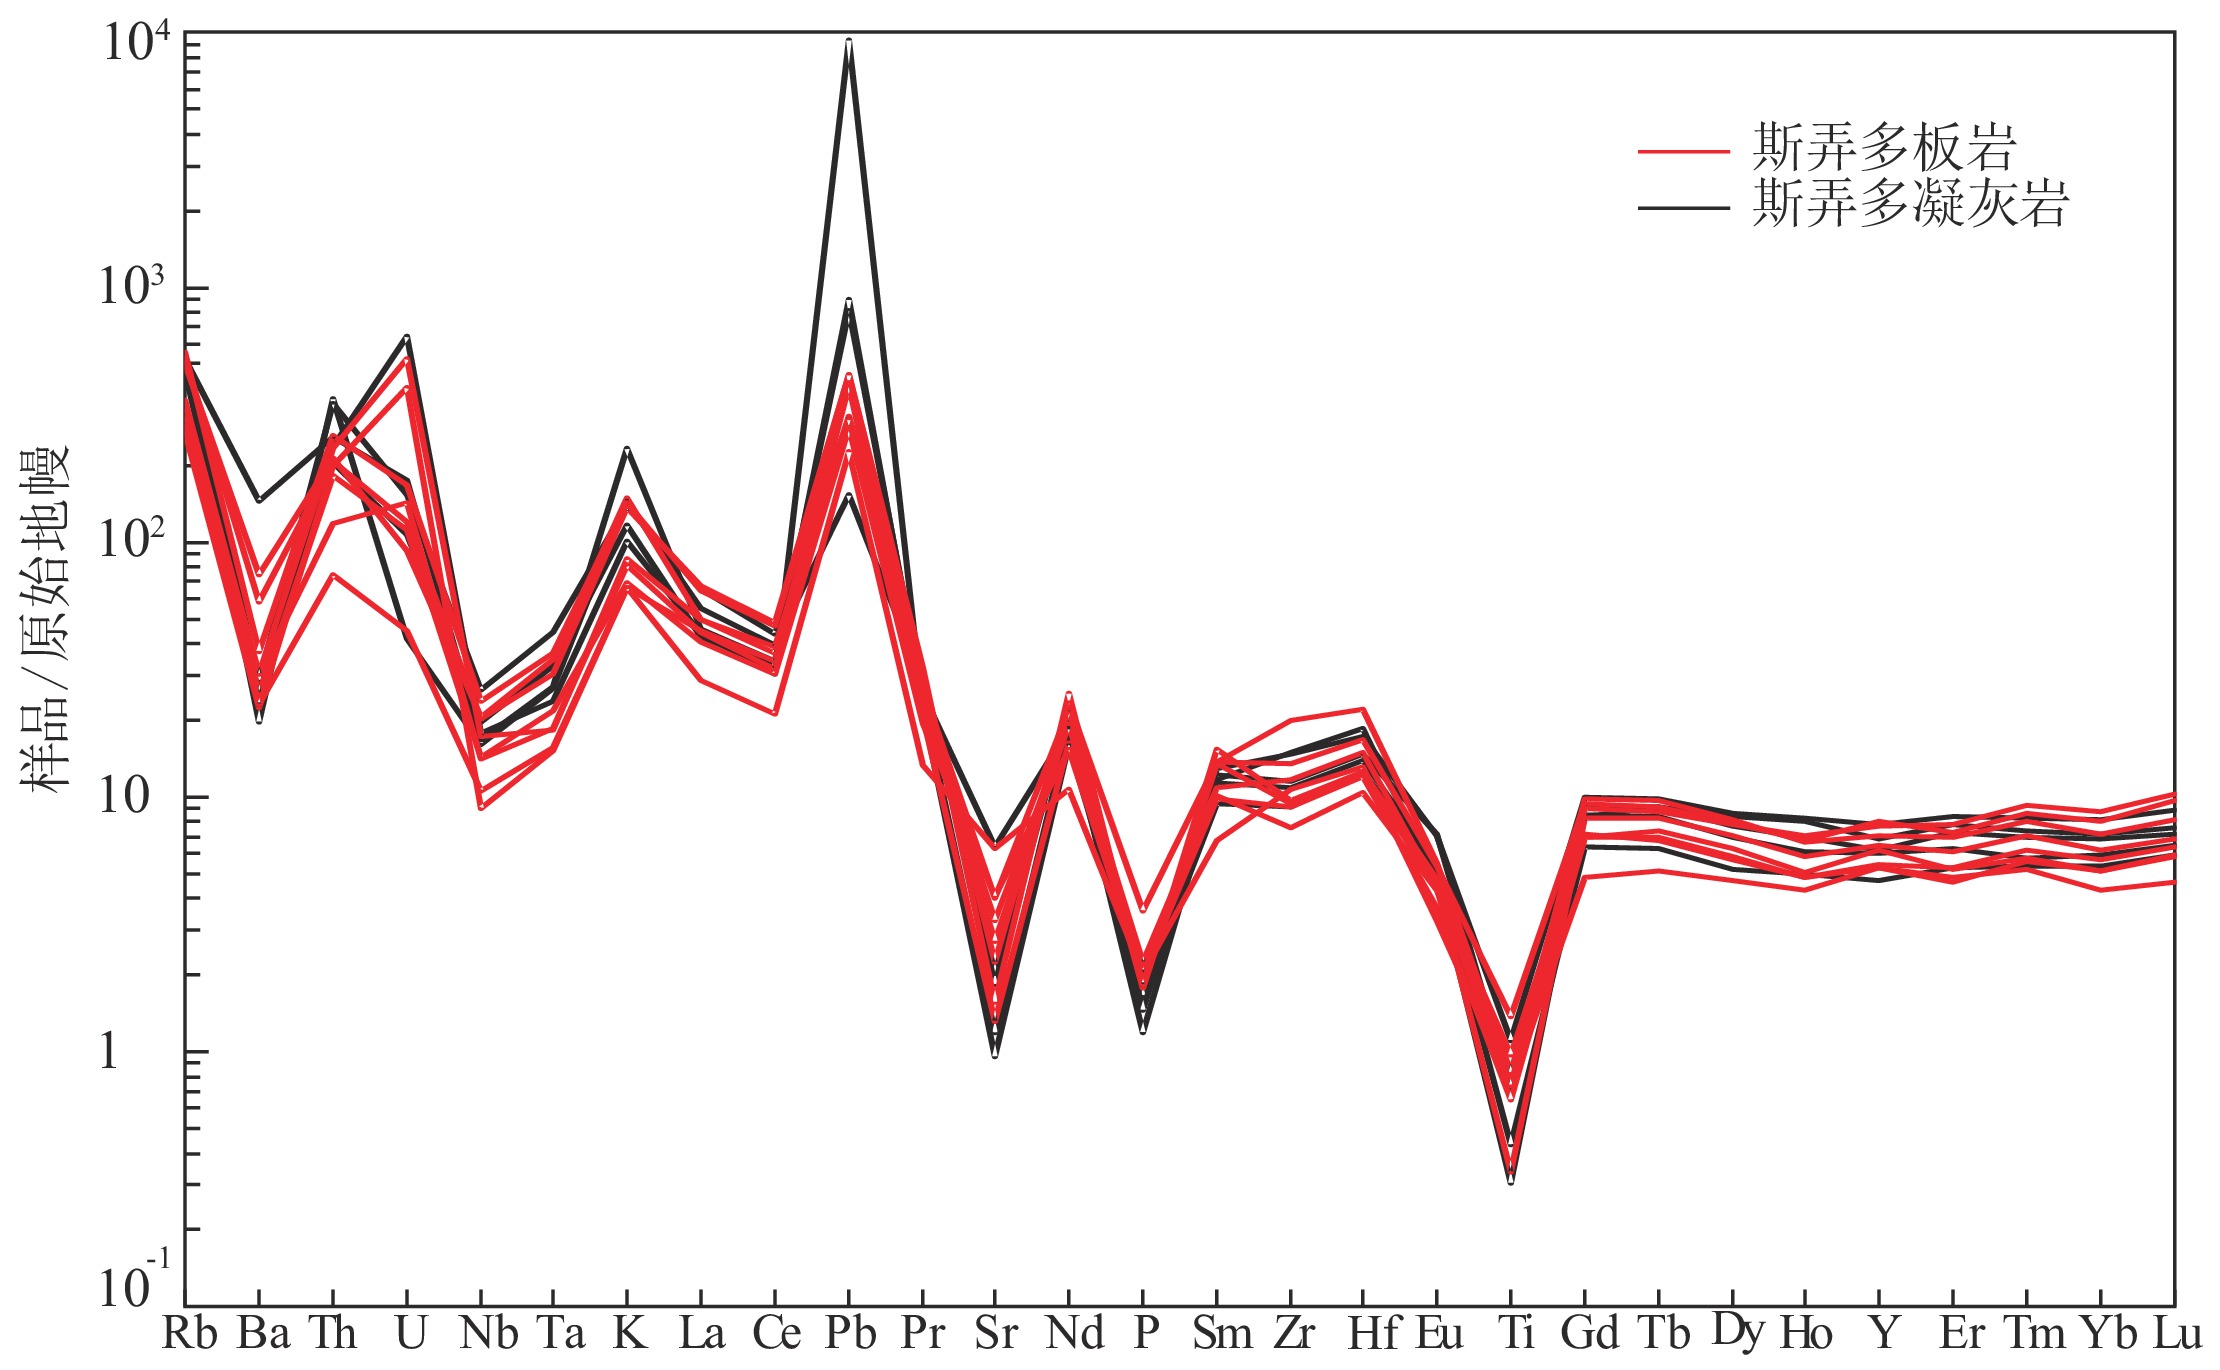
![]() Primitive mantle-normalized (Sun and McDonough, 1989) trace element diagram for the slate from the Sinongduo Ag polymetallic deposit (the data of the Sinongduo tuff are after Ding et al., 2017)
Primitive mantle-normalized (Sun and McDonough, 1989) trace element diagram for the slate from the Sinongduo Ag polymetallic deposit (the data of the Sinongduo tuff are after Ding et al., 2017)
-
![]() Protolith reconstruction diagrams for the slate from the Sinongduo Ag polymetallic deposit (Winchester and Max, 1982)
Protolith reconstruction diagrams for the slate from the Sinongduo Ag polymetallic deposit (Winchester and Max, 1982)
-
![]() Harker diagrams of major elements for the slate from the Sinongduo Ag polymetallic deposit(the data of Sinongduo tuff are after Ding et al., 2017, the same below)
Harker diagrams of major elements for the slate from the Sinongduo Ag polymetallic deposit(the data of Sinongduo tuff are after Ding et al., 2017, the same below)
-
![]() Zr/TiO2–Nb/Y diagram of the slate from the Sinongduo Ag polymetallic deposit (Winchester and Floyd, 1977)
Zr/TiO2–Nb/Y diagram of the slate from the Sinongduo Ag polymetallic deposit (Winchester and Floyd, 1977)
-
![]() Mineralization in the slate from the Sinongduo Ag polymetallic deposit
Mineralization in the slate from the Sinongduo Ag polymetallic deposit
-
![]() As–FeO diagram for the slate from the Sinongduo Ag polymetallic deposit (the data of Sinongduo magmatic rocks are after Yang et al., 2021)
As–FeO diagram for the slate from the Sinongduo Ag polymetallic deposit (the data of Sinongduo magmatic rocks are after Yang et al., 2021)